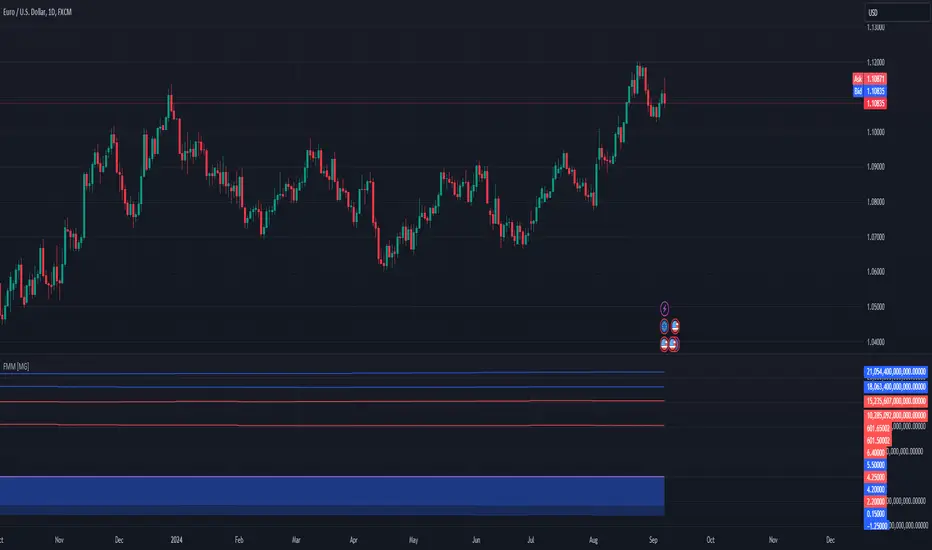
FinFluential Global M2 Money Supply // Days Offset =The "Global M2 Money Supply" indicator calculates and visualizes the combined M2 money supply from multiple countries and regions worldwide, expressed in trillions of USD.
M2 is a measure of the money supply that includes cash, checking deposits, and easily convertible near-money assets. This indicator aggregates daily M2 data from various economies, converts them into a common USD base using forex exchange rates, and plots the total as a single line on the chart.
It is designed as an overlay indicator aligned to the right scale, making it ideal for comparing global money supply trends with price action or other market data.
Key Features
Customizable Time Offset: Users can adjust the number of days to shift the M2 data forward or backward (from -1000 to +1000 days) via the indicator settings. This allows for alignment with historical events or forward-looking analysis.
Global Coverage Includes:
Eurozone: Eurozone M2 (converted via EUR/USD)
North America: United States, Canada
Non-EU Europe: Switzerland, United Kingdom, Finland, Russia
Pacific: New Zealand
Asia: China, Taiwan, Hong Kong, India, Japan, Philippines, Singapore
Latin America: Brazil, Colombia, Mexico
Middle East: United Arab Emirates, Turkey
Africa: South Africa
[b]forex

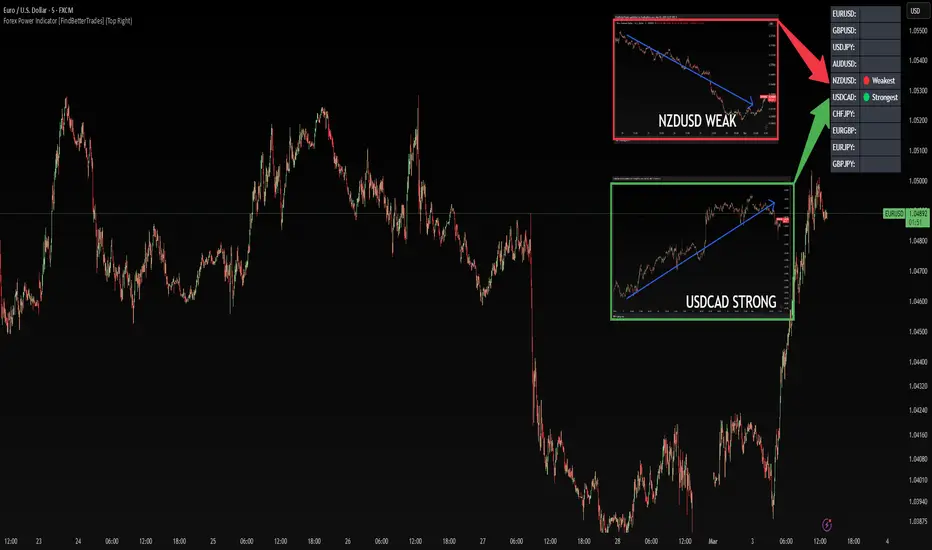
Forex Power Indicator [FindBetterTrades]The Forex Power Indicator is designed to help traders quickly assess the relative strength and weakness of key forex pairs over a set period.
This tool calculates the percentage change in price over the last 5 days and highlights the strongest and weakest performing pairs in a simple table format.
Features:
Scans 10 major forex pairs (EURUSD, GBPUSD, USDJPY, AUDUSD, NZDUSD, USDCAD, CHFJPY, EURGBP, EURJPY, GBPJPY).
Calculates the percentage change over the last 5 days.
Identifies and labels the strongest and weakest pair based on performance.
Displays results in a customizable table, allowing traders to quickly interpret market trends.
How to Use:
The strongest pair (🟢) indicates the currency with the highest performance in the selected period.
The weakest pair (🔴) shows the currency that has lost the most value.
Alerts feature:
Once you add the script to your chart, go to "Create Alert"
Under "Condition", select "Forex Power Indicator ".
The system will use the messages set in the alert() function.
When triggered, the alert will display the message like:
"New strongest currency pair: USDJPY"
"New weakest currency pair: AUDUSD"
Use this information to spot momentum opportunities, potential reversals, or trend continuations in forex trading.
This indicator is for informational purposes only and should be used alongside other technical analysis tools to support trading decisions.
Ivan Gomes StrategyIG Signals+ - Ivan Gomes Strategy
This script is designed for scalping and binary options trading, generating buy and sell signals at the beginning of each candle. Although it is mainly optimized for short-term operations, it can also be used for medium and long-term strategies with appropriate adjustments.
How It Works
• The indicator provides buy or sell signals at the start of the candle, based on a statistical probability of candle patterns, depending on the timeframe.
• It is essential to enter the trade immediately after the signal appears and exit at the end of the same candle.
• If the first operation results in a loss (Loss), the script will send another trade signal at the start of the next candle. However, if the first trade results in a win (Gain), no new signal will be generated.
• The signals follow cycles of 3 candles, regardless of the timeframe. However, if a Doji candle appears, the cycle is interrupted, and no signals will be generated until the next valid cycle starts.
• The strategy consists of up to two trades per cycle: if the first trade is not successful, the second trade serves as an additional attempt to recover.
Key Points to Consider
1. Avoid trading in sideways markets – If price levels do not fluctuate significantly, the accuracy of the signals may decrease.
2. Trade in the direction of the trend – Using Ichimoku clouds or other trend indicators can help confirm trend direction and improve signal reliability. If the market is in an uptrend (bullish trend) and the indicator generates a sell signal, the most prudent decision would be to wait for a buy signal that aligns with the main trend. The same applies to downtrends, where buy signals may be riskier.
These decisions should be based on chart reading and supported by other technical analysis tools, such as support and resistance levels, which indicate zones where price might face obstacles or reverse direction. Additionally, Fibonacci retracement levels can help identify possible pullback points within a trend. Moving averages are also useful for visualizing the general market direction and confirming whether an indicator signal aligns with the overall price structure. Combining these tools can increase trade accuracy and prevent unnecessary trades against the main trend, reducing risks.
3. Works based on probability statistics – The algorithm analyzes candle formations and their statistical probabilities depending on the timeframe to optimize trade entries.
4. Best suited for scalping and binary options – This strategy performs best in 1-minute and 5-minute timeframes, allowing for multiple trades throughout the day.
Technical Details
• The script detects the candle cycle and assigns an index to each candle to identify patterns and possible reversals.
• It recognizes reference candles, stores their colors, and compares them with subsequent candles to determine if a signal should be triggered.
• Doji candle rules are implemented to avoid false signals in indecisive market conditions. When a Doji appears, the script does not generate signals for that cycle.
• The indicator displays visual alerts and notifications, ensuring fast execution of trades.
Disclaimer
The IG Signals+ indicator was created to assist traders who struggle to analyze the market by providing objective trade signals. However, no strategy is foolproof, and this script does not guarantee profits.
Trading involves significant financial risk, and users should test it in a demo account before trading with real money. Proper risk management is crucial for long-term success.

Interest Rate & CPI Differential By King OsamaINTEREST RATE & CPI Differential Indicator By King Osama
A must-have tool for forex traders and macro analysts, this indicator tracks interest rate differentials, real interest rate gaps, and CPI (inflation) differences to provide a fundamental edge in trading.
Key Features:
✅ Interest Rate Differential (Rate Diff) – Measures the gap between base and quote currency interest rates. Higher rates attract capital, influencing currency strength. Ideal for carry trade opportunities.
✅ Real Interest Rate Differential (Real Rate Diff) – Adjusts interest rates for inflation (CPI) to reflect the true return on holding a currency. A more accurate indicator of long-term strength.
✅ CPI Differential (CPI Diff) – Compares inflation rates between two economies, helping traders anticipate central bank actions (rate hikes/cuts) based on inflation trends.
✅ Dynamic Table & Bias Signals – Clear LONG/SHORT indications, historical tracking, and real-time updates for macro-driven forex decisions.
🔹 Perfect for swing traders combining fundamentals with technicals! 🚀

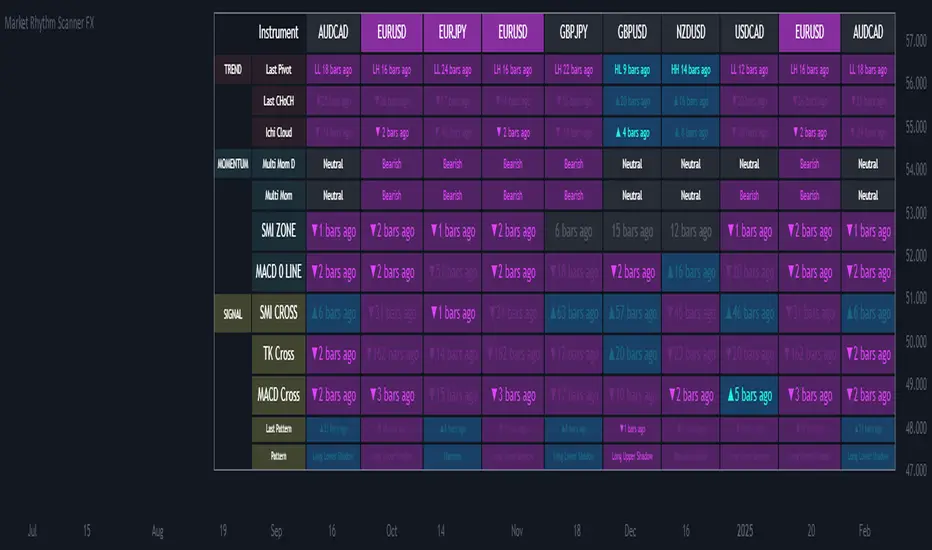
Ultimate Market Rhythm Scanner FXReady to feel like a chart-wielding wizard? The Ultimate Market Rhythm Scanner FX is here to supercharge your Forex analysis by piping in multi-timeframe goodness from up to 10 OANDA currency pairs. You’ll see structure breakouts, Ichimoku signals, MACD pulses, RSI/Bollinger momentum waves, and candlestick patterns—all at once.
Think of it as your own personal mission control dashboard, scanning the FX galaxy and beaming back color-coded signals so you know instantly where the market action is hottest. Remember, to keep the data aligned, you’ll want to load this indicator on an OANDA FX pair chart (like OANDA:EURUSD) so everything lines up perfectly behind the scenes.
Key Features
Market Structure Wizardry
Locates pivot highs and lows (Higher High, Lower Low, etc.)
Spots breakouts above/below these pivots
Shouts out “CHoCH” (Change of Character) when structure flips from bullish to bearish (or vice versa)
If you want to understnd more about the market structure logic in this script check out my other script, it uses the same logic:
Tracks price above/below the Ichimoku Cloud
Flags Tenkan/Kijun crosses for bullish or bearish setups
MACD & SMI Insights
MACD line vs. Signal Cross & crossing the Zero line
SMI crosses in overbought/oversold “zones” (because pure oscillator mania is cool)
Momentum Radar
Mashes up RSI + Bollinger + Ichimoku for either “Bullish,” “Bearish,” or “Neutral”
Also checks a separate Daily timeframe for cosmic perspective
Candlestick Pattern Goodness
Detects common candle formations (Hammer, Hanging Man, Marubozu, etc.)
Tells you exactly how many bars ago they flashed their signals
Time Fade Magic
Recent signals shine bright
Older signals fade out like invisible ninjas after a user-defined number of bars
Explanation of Settings
Below lies the control panel for your new chart-snooping sidekick:
Symbol Settings (Symbol 1...Symbol 10)
Select multiple FX OANDA pairs (like OANDA:AUDUSD).
Each pair spawns a new column in the scanner table.
Ensure your chart is also set to an OANDA pair—the script only speaks “OANDA.”
Ichimoku Settings
Use Ichimoku Filter: Toggles everything Ichimoku.
conversionPeriods, basePeriods, laggingSpan2Periods, displacement: The classic Ichimoku parameters to mold your cloud magic.
Pivot Logic
Pivot Source: Wicks vs. Closes for pivot detection.
BOS Confirmation: If you prefer breakouts confirmed by wicks or closes.
Left Swing Length: Bars left for pivots.
Right Swing Length High / Low: Bars right for pivot confirmation.
Invert Right Swing in Bearish Trend: Auto-flip logic when gloom takes over. This means right swing size high value will become right swing size low value in a bearish trend (determined by latest CHoCH).
RSI & Bollinger
RSI Period: The heartbeat of RSI.
RSI Overbought / Oversold: Thresholds for RSI mania.
BB Length / StdDev: The Bollinger band radius for measuring price expansions.
MACD
fastLength, slowLength, signalLength: The trifecta that shapes your MACD wave.
SMI Settings
Nested variables for SMI’s K, D, and EMA lengths.
Overbought and Oversold levels for zone detection.
Time Display Settings
Fade out old signals: Turn the fade effect on/off.
Fade After X Bars: The number of bars after which signals do a ghost trick.
Fade Transparency: How ghostly (0–100) those old signals become.
Table Settings
Show Table: Summon or banish the entire scanner table.
Table Position: Choose the quadrant for your new data-loving sidekick.
Table Text Size: Big or small text for those crucial signals.
Table Layout
With “Show Table” on, a futuristic readout appears, listing:
Columns: Each symbol’s name runs across the top (up to 10).
Rows: A row for each technical aspect, such as:
Last Pivot (pivot) – The most recent pivot type (HH, HL, LH, LL) and how many bars ago.
Last CHoCH – Crows “▲/▼ X bars ago” if structure reversed.
Ichi Cloud (ichi) – Tells you if price soared above or dived below the Cloud.
Multi Mom D (momentum_d) – A daily momentum label (Bullish/Bearish/Neutral). It shows you daily momentum even on times frames lower than the daily. Multi Mom D is not reliable if the chart is on a time frame higher than the daily.
Multi Mom (momentum) – Current timeframe momentum label.
SMI ZONE (smizone) – If SMI’s in a bullish or bearish zone.
MACD 0 LINE (macdzero) – Number of bars since crossing zero.
SMI CROSS (smicross) – A bullish or bearish cross in overbought/oversold territory.
TK Cross (tk) – Tenkan/Kijun cross and how many bars ago.
MACD Cross (macd) – MACD crossing above/below its signal line.
Last Pattern (lastpat) – The candle pattern found and bars since it popped.
Pattern (pattype) – The name of that pattern (Hammer, Hanging Man, etc.).
Each cell can be tinted in a blue-ish glow for bullish vibes, or a purple shade for bearish signals. The “bars ago” text helps you see how fresh the signal is—fewer bars = more relevant.
Usage Notes
OANDA Chart is King
Always apply this indicator on an OANDA-based chart (e.g., OANDA:GBPJPY). If you deviate, the script might not retrieve data properly from the OANDA feed.
Symbol List
For each of the symbols inputs, pick your favorite currency crosses (all from the OANDA universe).
Timeframes
The script runs on your current chart’s timeframe for near-term action.
It simultaneously checks the daily timeframe to measure high-level momentum.
Fade-Out Feature
By default, signals older than 5 bars fade out. Adjust in “Time Display Settings” if you want them to linger.
Confluence is King
If a pivot breakout, bullish Ichimoku cross, and an SMI overbought cross all light up at once, you might have a short-term rocket on your hands. Always confirm with your trading plan!
Summary
Embrace your inner data nerd with the Market Rhythm Scanner FX—the ultimate multi-asset intelligence platform for OANDA Forex pairs. From subtle pivot changes to daily momentum shifts, from candle patterns to MACD fireworks, it’s all consolidated into one easy-to-digest control panel.
Step 1: Load up an OANDA chart (like “OANDA:EURUSD”).
Step 2: Enter your chosen OANDA pairs under “Symbol Settings.”
Step 3: Geek out over the instant real-time multi-indicator table, letting you see which instruments are sizzling or fizzling.
No more frantic tab-hopping. Save your mental bandwidth for the big decisions.
Let the Ultimate Market Rhythm Scanner FX be your ever-watchful sidekick, scanning the charts so you can conquer the Forex battlefield like the tech-savvy champion you are!
This script is free to use at present, but I reserve the right to move it behind a paywall in the future.
Dynamic Weighted Price Flow [QuantAlgo]Experience a brand new way of analyzing price movement with Dynamic Weighted Price Flow , an advanced technical tool that utilizes the uniqueness of weighted price and dynamic momentum analysis to evaluate trends and deliver high-probability signals. Whether you're a long-term investor seeking major trend confirmation or an active trader looking for precise entries and exits, this indicator's sophisticated and innovative approach to price flow analysis offers invaluable market insights you can only find at QuantAlgo !
🟢 Core Architecture
The Dynamic Weighted Price Flow's foundation rests on its innovative weighted price calculation and momentum-based trend scoring system. By implementing a unique price weighting algorithm alongside Hull Moving Average smoothing, each market move is evaluated within a dynamic context while maintaining exceptional responsiveness to price action. This refined approach helps identify genuine trend transitions while filtering out market noise across multiple timeframes and instruments.
🟢 Technical Foundation
Three key components of this indicator are:
Weighted Price Analysis: Utilizes a sophisticated weighting system that prioritizes recent price action
Momentum Range Processing: A comprehensive scoring system that evaluates price momentum across multiple periods
Dynamic Trend State Management: A normalized system that tracks and validates trend transitions
🟢 Practical Usage Tips
Here's how to maximize your use of the Dynamic Weighted Price Flow :
1/ Setup:
Add the indicator to your favorites ⭐️
Start with the default baseline period for balanced analysis
Use the recommended momentum range for optimal signal generation
Keep signal markers enabled for clear trend transitions
Customize accent colors to match your preferences
Enable dynamic price bars for complete visual feedback
2/ Reading Signals:
Monitor for triangle markers indicating trend transitions
Watch the main trend line color for direction confirmation
Observe the gradient fills for trend strength visualization
Use the built-in alert system to catch potential setups
🟢 Pro Tips
Adjust Baseline Period based on your trading style:
→ Lower values (1-5) for more responsive signals
→ Higher values (5-10) for more stable trend identification
Fine-tune Momentum Range based on market conditions:
→ Lower values (20-35) for shorter-term signals
→ Higher values (35-50) for longer-term trend following
Optimize Visual Settings for your strategy:
→ Enable signal markers for clear entry/exit points
→ Use dynamic price bars for enhanced trend visualization
Combine with:
→ Volume indicators for trade confirmation
→ Support/resistance levels for entry refinement
→ Multiple timeframe analysis for strategic context

Monthly DividerThis Trading View indicator visually marks the beginning of each month starting from January 2024. It draws vertical lines on the chart at the start of each month and labels them with the corresponding month abbreviation (e.g., "Jan", "Feb"). Users can customize the color and thickness of the lines through the indicator settings, allowing for personalized chart aesthetics. This tool is ideal for traders and analysts who want to easily identify month transitions and enhance their technical analysis.

Quarterly Divider The "Quarterly Divider" script draws vertical lines at the start of each quarter (January, April, July, October) on the Trading View chart. It also labels each line with the corresponding quarter (Q1, Q2, Q3, Q4) at the bottom of the line, making it easy to visualize the start of each trading quarter. The color and thickness of the lines are customizable
NB. works effectively is used on the weekly timeframe

goose's session + killzone indicatorA powerful, multi-functional TradingView script designed for forex traders. It visually delineates major market sessions—Asia, London, and New York—on the chart, provides customizable session ranges, pip range counters, and configurable “killzone” markers. The indicator allows users to switch between a traditional line-and-fill style and a historical box style for session visualization, offering both real-time and historical context of market ranges.
Key Features:
1. Session Visualization Options:
• Lines & Fill Style:
• Highlights active sessions using dynamic lines and filled areas that update in real-time.
• Displays session high, low, and mid-range boundaries with customizable colors, border widths, and line styles.
• Historical Boxes Style:
• Creates and retains boxes for each past session, enabling users to review historical session ranges over extended periods.
• Each session box is drawn with user-defined fill and border colors, opacity, and line styles, anchored to the session’s high, low, and timeframe.
• Supports viewing multiple historical sessions at once, up to a configurable limit.
2. Pip Range Counters:
• Displays the range of pips for each active session, anchored to a fixed position near the bottom-right corner of the session.
• Uses arrow-style labels (label.style_label_up/down) to maintain a stable visual offset relative to the session, minimizing movement during vertical zoom.
• Customizable text size, color, and vertical offset, ensuring the pip counter remains legible and unobtrusive.
3. Killzone Lines:
• Allows users to define up to 15 custom “killzone” times with specific line colors, styles, and optional labels.
• Each killzone is drawn precisely when the price crosses the user-specified time, marking important market events or transitions.
4. User Configurations:
• Session Times: Fully adjustable start and end times for Asian, London, and New York sessions.
• Color & Style Settings:
• Customizable fill and border colors (with adjustable opacity) for each session style.
• User-friendly dropdowns and checkboxes for setting line styles, widths, and text sizes.
• Display Mode Selector:
• A dropdown (sessionStyle) lets users toggle between “Lines & Fill” and “Historical Boxes” for session visualization.
• Pip Counter and Killzone Settings:
• Options to show or hide pip counters, match label colors to session fills, and configure killzone appearance individually.
5. Robust Utility Functions:
• Functions to parse user-input times, determine if the current time falls within a session, and calculate session ranges.
• Historical session logic that detects session transitions and creates/upgrades boxes accordingly.
How It Works:
• Session Style Selection:
• Users choose their preferred visualization style via the sessionStyle dropdown.
• If “Lines & Fill” is selected, the indicator plots dynamic lines and fills during active sessions.
• If “Boxes” is selected, the indicator creates historical boxes that outline the range of each past session, persisting on the chart until session boundaries change.
• Pip Counter Labeling:
• During an active session, the pip counter calculates the range between the session’s high and low and displays it as text positioned just below the bottom-right corner of the session.
• The use of arrow-style labels ensures the text remains at a stable visual distance from the session’s outline, even when zooming vertically.
• Killzones:
• Users can define specific times (“killzones”) where important market events occur.
• When the price crosses these times, the script draws lines and optional labels with user-defined appearance settings.
Ideal Use Cases:
• Real-Time Trading: Quickly identify current session ranges, pip sizes, and crucial killzone markers during live trading.
• Historical Analysis: Switch to Historical Boxes to review past session ranges over days, weeks, or months, aiding in pattern recognition and strategy refinement.
• Customization: Tailor the appearance to match personal preferences or chart themes, including colors, styles, line widths, and label sizes.
This comprehensive indicator combines real-time session tracking with historical range visualization and customizable killzones. Its dual display modes, extensive settings, and stable pip counter labels make it a versatile tool for forex traders seeking to analyze market sessions both in the moment and retrospectively.

Market Anomaly Detector (MAD)Market Anomaly Detector (MAD) Indicator - Detailed Description:
The Market Anomaly Detector (MAD) Indicator is a unique tool designed to identify potential market anomalies by combining several price action-based and momentum indicators. This indicator is especially useful for traders who seek to identify significant market shifts and anomalies before they become visible in conventional technical indicators.
Key Features of the MAD Indicator:
1. Z-Score Threshold for Anomaly Detection:
• The Z-Score measures how far a current price is from its average over a defined period, normalized by standard deviation. This allows the MAD indicator to detect outliers or anomalies in price movements.
• By adjusting the Z-Score Threshold, traders can tune the sensitivity of the indicator to capture only the most significant price deviations, filtering out noise and reducing false signals.
2. Volume and Liquidity Filter:
• Volume is a key indicator of market participation and sentiment. The MAD Indicator uses a volume multiplier to assess when price movements are supported by sufficient trading volume.
• A volume spike is identified when the current volume exceeds the average volume by a certain multiplier. This ensures that only high-confidence signals are generated, particularly useful for spotting trend reversals and breakout opportunities.
3. Signal Cooldown Period:
• To prevent overfitting and reduce false signals, a signal cooldown period is implemented. Once a buy or sell signal is triggered, the indicator waits for a specified number of bars (e.g., 5) before triggering another signal, even if the price action meets the criteria for a new signal. This helps maintain a cleaner trading environment and avoids confusion when the market is volatile.
4. Upper and Lower Bands for Trend Confirmation:
• The MAD Indicator uses bands based on the mean price and standard deviation, similar to Bollinger Bands. These upper and lower bands help to define the expected price range for a given period, indicating overbought or oversold conditions.
• The combination of Z-Score, volume, and band analysis helps pinpoint when the price breaks out of expected ranges, providing early warning signs for potential market shifts.
5. Trend Confirmation from Higher Timeframes:
• The MAD Indicator includes a multi-timeframe approach to trend confirmation, using the 50-period EMA on a higher timeframe (e.g., 1-hour chart). This ensures that signals are aligned with the overall market trend, enhancing the reliability of buy and sell signals.
How It Works:
• The MAD Indicator continuously monitors price action, volume, and statistical anomalies, using the Z-Score to determine when the price is significantly deviating from its historical average.
• When the price breaks above the upper band and a bullish anomaly is detected, a buy signal is generated. (Green Background)
• Similarly, when the price breaks below the lower band and a bearish anomaly is detected, a sell signal is triggered. (Red Background
• By filtering signals based on volume and using the cooldown period, the MAD Indicator ensures that only high-quality trades are signaled.
How to Use the MAD Indicator:
• Buy Signal: Occurs when the price breaks above the upper band and there is a significant deviation from the mean (bullish anomaly).
• Sell Signal: Occurs when the price breaks below the lower band and there is a significant deviation from the mean (bearish anomaly).
• Volume Confirmation: Ensure that the buy/sell signals are supported by a volume spike, indicating strong market participation.
• Signal Cooldown Period: After a signal is triggered, the indicator waits for the cooldown period to avoid triggering multiple signals in quick succession.
Why It’s Worth Paying For:
The MAD Indicator combines advanced statistical analysis (Z-Score), price action, and volume analysis to identify market anomalies and breakouts before they are visible on standard indicators. By leveraging the power of mean reversion and statistical anomalies, this tool provides traders with high-confidence signals that can lead to profitable trades, especially in volatile markets. The integration of a multi-timeframe trend filter ensures that signals are aligned with the overall market trend, reducing the likelihood of false breakouts.
This indicator is ideal for trend-following traders looking for high-probability entries and mean-reversion traders aiming to capture price deviations. The signal cooldown period and volume filter provide an additional layer of precision, ensuring that you only act on the strongest market signals.

Resistance & SupportThis indicator combines multiple analytical methods to calculate potential support and resistance levels for the upcoming trading day, leveraging historical price data. The calculations are based on three key areas:
Pivot Points: These are calculated using the previous day's high, low, and close values to provide central price levels, along with first and second-level support and resistance (S1, S2, R1, R2). These levels are commonly used in technical analysis and can serve as reference points for market entries and exits.
3-Day Price Average (3DBP): This value provides a short-term trend signal by averaging the high, low, and close prices over the past three days. The indicator helps identify whether the market has been trading at higher or lower levels recently, which can signal bullish or bearish trends.
Trend Detection: The script also includes a short-term and long-term trend analysis:
Short-Term Trend: The prior day’s 3DBP is compared to the previous day’s 3DBP to gauge the market's short-term direction.
Long-Term Trend: The prior close is compared to the open from 50 days ago, offering an indication of the overall market trend.
These components work together to provide actionable insights on potential entry points. For example:
In a bullish market, support levels may act as potential entry points for long trades when the price retraces.
In a bearish market, resistance levels may act as potential entry points for short trades upon price rejection.
The Trend Table at the top right of the chart displays the short-term and long-term trend information for quick reference. It shows whether the trends are bullish or bearish based on the calculations above.
While originally optimized for the EUR/USD currency pair, this indicator can be applied to other forex pairs. However, results may vary depending on the instrument, and further testing is recommended for non-EUR/USD pairs.
Usage Notes:
Pivot points can often act as both support and resistance. While they provide useful reference levels, in volatile markets, these levels may not always hold. Tight stop-losses are recommended if trading near these levels.
The 3DBP offers insight into past market behavior, and although it’s not guaranteed to act as support or resistance, it can help identify zones of interest in the short term.
This indicator is designed to provide a structured approach to price action analysis, incorporating widely-recognized methods like pivot points and trend detection, while adding unique elements like the 3DBP to enhance its utility.
Adaptive Range Breakout (ARB) IndicatorTitle: Adaptive Range Breakout (ARB) Indicator – Enhanced Mean Reversion with Dynamic Support/Resistance
Overview: The Adaptive Range Breakout (ARB) Indicator is designed to help traders identify potential mean reversion and breakout opportunities by leveraging a dynamic range based on recent price action and volatility. This script combines key elements such as Volume Profile analysis, ATR-based volatility adjustments, and an EMA trend filter to create a robust and adaptive trading tool. It aims to capture both trend continuations and reversals while filtering out noise in choppy markets.
Justification for Combining Components:
HVN (High Volume Node):
The core of this indicator is built around a custom VWAP calculation over a defined lookback period, which serves as the HVN line (High Volume Node). The HVN represents a volume-weighted average price, highlighting key levels where significant trading activity has occurred. These levels often act as areas of support or resistance, providing a reliable reference point for traders.
ATR-Based Dynamic Support and Resistance:
The Average True Range (ATR) is used to adjust the adaptive support and resistance levels around the HVN line. This ensures that the levels dynamically respond to changes in market volatility. The use of ATR helps filter out insignificant price movements and focuses on significant shifts in momentum, making the indicator adaptive to different market conditions.
EMA Trend Filter:
An Exponential Moving Average (EMA) is applied as a trend filter to distinguish between trending and range-bound market conditions. This filter helps in identifying whether the price movement is in line with the overall trend or if a potential reversal is more likely. By using the EMA crossover signals, the indicator can provide additional confirmation before generating buy or sell signals.
Adaptive Breakout and Mean Reversion Signals:
The indicator generates buy and sell signals based on the interaction between the price and the adaptive support/resistance levels. It incorporates a volatility filter to ensure that signals are only triggered when the market is sufficiently volatile, reducing the likelihood of false signals during low-volatility periods. Additionally, a cooldown period is implemented to prevent consecutive signals in quick succession, enhancing signal reliability.
Key Features:
Dynamic Range Levels: The adaptive support and resistance levels adjust based on recent price action and volatility, providing reliable areas for potential reversals or breakouts.
Volume-Weighted Analysis: The HVN line, derived from a custom VWAP calculation, highlights key price levels with significant trading activity, helping identify zones of support/resistance.
Trend Confirmation: The EMA trend filter helps differentiate between trend-following and mean-reversion signals, providing context for the generated buy and sell signals.
Volatility Filtering: The indicator uses ATR to gauge market volatility, ensuring signals are only generated during active market conditions.
Signal Cooldown: A customizable cooldown period reduces noise by spacing out signals, especially in choppy market environments.
Use Case:
The Adaptive Range Breakout (ARB) Indicator is suitable for traders looking to capitalize on both breakouts and mean-reversion opportunities. It is particularly useful in:
Range-Bound Markets: The adaptive support and resistance levels help capture reversals in range-bound conditions.
Trending Markets: The trend filter and breakout logic allow traders to follow momentum when the price breaks through key adaptive levels.
Intraday and Swing Trading: The dynamic nature of the indicator makes it applicable across different timeframes, catering to both intraday and swing traders.
Important Considerations:
This indicator does not guarantee future performance or provide an infallible prediction of price movements. It is a tool intended to support traders in their decision-making process based on historical price action and market conditions.
The effectiveness of the signals may vary depending on the asset, market conditions, and timeframe used. It is recommended to backtest the indicator and use it alongside other analysis techniques.
Always exercise caution and use appropriate risk management strategies when trading based on signals generated by this indicator.
Alerts: The indicator includes built-in alerts for:
Buy Signal Alert: Triggered when the price crosses above the adaptive support level, suggesting a potential reversal or continuation in an uptrend.
Sell Signal Alert: Triggered when the price crosses below the adaptive resistance level, indicating a potential reversal or continuation in a downtrend.
EMA Crossover Alerts: Alerts for EMA crossover signals, providing additional trend confirmation.
This script is a comprehensive tool designed to adapt to market conditions dynamically, combining multiple techniques to create a well-rounded approach to identifying trading opportunities. We encourage users to integrate it into their broader trading strategy and apply it with caution, understanding its strengths and limitations.

TimeFlow Momentum IndicatorThe “TimeFlow Momentum Indicator” is a thoughtfully crafted tool that integrates multiple analytical components to deliver a unique perspective on market momentum. It is not a mere combination of existing indicators, but rather a purposeful integration where each element plays a specific role, enhancing the overall functionality and reliability of the script. The primary aim is to provide traders with a more comprehensive and accurate analysis by leveraging time-based divergence, volume validation, and trend filtering.
1. Time-Based Momentum Divergence: The Core Innovation
• The heart of the indicator is the Time Divergence Line, which introduces a unique approach to analyzing momentum by focusing on the time spent in uptrends versus downtrends. Unlike traditional momentum indicators that rely purely on price movements (e.g., RSI, MACD), the Time Divergence Line captures the duration of market trends, offering a different perspective on momentum shifts.
• This method counts consecutive bars where the price closes higher (uptrend) or lower (downtrend) and calculates the difference between these counts. By measuring the time spent in different trend directions, the indicator can detect early signs of trend exhaustion or potential reversals, which are often missed by price-based indicators.
2. EMA Smoothing: Enhancing Signal Clarity
• The raw time divergence data is smoothed using an Exponential Moving Average (EMA) to filter out noise and provide a clearer, more reliable signal. The EMA helps to capture the underlying trend in the divergence data, making it easier for traders to identify meaningful shifts in momentum without being misled by short-term price fluctuations.
• This smoothing technique is crucial because it reduces false signals, ensuring that the divergence line reflects the true momentum of the market.
3. Overlay Plotting for Better Visualization
• The smoothed Time Divergence Line is directly plotted on the main price chart, offering traders a visual overlay that correlates directly with price action. This design choice enhances the usability of the indicator by allowing traders to see the divergence line’s relationship with the price in real-time, making it easier to spot potential buy and sell signals.
• By overlaying the divergence line on the main chart, the indicator provides a visual representation of momentum divergence, which is more intuitive and actionable compared to separate oscillators.
4. Trend Confirmation Using VWAP and EMA
• To increase the reliability of signals, the indicator incorporates a trend filter using both VWAP (Volume Weighted Average Price) and EMA (50-period). This filter ensures that signals are generated only when they align with the prevailing market trend:
• The VWAP is used to gauge the average price considering the volume, acting as a dynamic support/resistance level. It helps to confirm whether the market sentiment is bullish or bearish.
• The EMA (50-period) acts as a trend-following indicator, smoothing out price action and providing a clear signal of the overall trend direction.
• This dual-filter approach helps to eliminate false signals that may occur during choppy or sideways market conditions, ensuring that the generated signals are more aligned with the broader market trend.
5. Volume Correlation for Signal Validation
• The indicator integrates a volume filter to confirm the validity of momentum signals. It checks whether the current volume exceeds a threshold based on the average volume, ensuring that signals are only generated when there is strong market participation.
• This volume correlation check is vital because it validates price movements by confirming that they are backed by significant trading activity, reducing the likelihood of false signals in low-volume conditions.
6. Cooldown Mechanism: Controlling Signal Frequency
• To prevent excessive signals, especially during volatile or sideways market conditions, the indicator implements a cooldown period. This feature enforces a minimum number of bars between consecutive signals, reducing noise and preventing traders from being overwhelmed by frequent alerts.
• The cooldown mechanism enhances the signal quality, ensuring that each buy or sell signal is meaningful and not just a result of short-term fluctuations.
How the Components Work Together
The TimeFlow Momentum Indicator is a cohesive tool where each component plays a specific and complementary role:
1. Time Divergence Line identifies shifts in market momentum by analyzing the duration of trends.
2. EMA Smoothing refines the divergence data, providing a clearer signal by filtering out noise.
3. Trend Filter (VWAP + EMA) ensures that signals are generated in alignment with the prevailing market trend, reducing the risk of false signals.
4. Volume Filter validates signals based on trading activity, confirming that price movements are backed by strong volume.
5. Cooldown Mechanism controls the frequency of signals, preventing overtrading and reducing noise.
Conclusion
The “TimeFlow Momentum Indicator” is an innovative tool that offers a new way of analyzing market momentum by focusing on time-based divergence. It combines this original approach with trend and volume filters to create a reliable, user-friendly indicator that can help traders identify high-probability entry and exit points. This is not a simple mashup of existing indicators but a well-designed integration where each component enhances the overall functionality, providing traders with a unique edge in market analysis.
Forex Heatmap█ OVERVIEW
This indicator creates a dynamic grid display of currency pair cross rates (exchange rates) and percentage changes, emulating the Cross Rates and Heat Map widgets available on our Forex page. It provides a view of realtime exchange rates for all possible pairs derived from a user-specified list of currencies, allowing users to monitor the relative performance of several currencies directly on a TradingView chart.
█ CONCEPTS
Foreign exchange
The Foreign Exchange (Forex/FX) market is the largest, most liquid financial market globally, with an average daily trading volume of over 5 trillion USD. Open 24 hours a day, five days a week, it operates through a decentralized network of financial hubs in various major cities worldwide. In this market, participants trade currencies in pairs , where the listed price of a currency pair represents the exchange rate from a given base currency to a specific quote currency . For example, the "EURUSD" pair's price represents the amount of USD (quote currency) that equals one unit of EUR (base currency). Globally, the most traded currencies include the U.S. dollar (USD), Euro (EUR), Japanese yen (JPY), British pound (GBP), and Australian dollar (AUD), with USD involved in over 87% of all trades.
Understanding the Forex market is essential for traders and investors, even those who do not trade currency pairs directly, because exchange rates profoundly affect global markets. For instance, fluctuations in the value of USD can impact the demand for U.S. exports or the earnings of companies that handle multinational transactions, either of which can affect the prices of stocks, indices, and commodities. Additionally, since many factors influence exchange rates, including economic policies and interest rate changes, analyzing the exchange rates across currencies can provide insight into global economic health.
█ FEATURES
Requesting a list of currencies
This indicator requests data for every valid currency pair combination from the list of currencies defined by the "Currency list" input in the "Settings/Inputs" tab. The list can contain up to six unique currency codes separated by commas, resulting in a maximum of 30 requested currency pairs.
For example, if the specified "Currency list" input is "CAD, USD, EUR", the indicator requests and displays relevant data for six currency pair combinations: "CADUSD", "USDCAD", "CADEUR", "EURCAD", "USDEUR", "EURUSD". See the "Grid display" section below to understand how the script organizes the requested information.
Each item in the comma-separated list must represent a valid currency code. If the "Currency list" input contains an invalid currency code, the corresponding cells for that currency in the "Cross rates" or "Heat map" grid show "NaN" values. If the list contains empty items, e.g., "CAD, ,EUR, ", the indicator ignores them in its data requests and calculations.
NOTE: Some uncommon currency pair combinations might not have data feeds available. If no available symbols provide the exchange rates between two specified currencies, the corresponding table cells show "NaN" results.
Realtime data
The indicator retrieves realtime market prices, daily price changes, and minimum tick sizes for all the currency pairs derived from the "Currency list" input. It updates the retrieved information shown in its grid display after new ticks become available to reflect the latest known values.
NOTE: Pine scripts execute on realtime bars only when new ticks are available in the chart's data feed. If no new updates are available from the chart's realtime feed, it may cause a delay in the data the indicator receives.
Grid display
This indicator displays the requested data for each currency pair in a table with cells organized as a grid. Each row name corresponds to a pair's base currency , and each column name corresponds to a quote currency . The cell at the intersection of a specific row and column shows the value requested from the corresponding currency pair.
For example, the cell at the intersection of a "EUR" row and "USD" column shows the data retrieved for the "EURUSD" currency pair, and the cell at the "USD" row and "EUR" column shows data for the inverse pair ("USDEUR").
Note that the main diagonal cells in the table, where rows and columns with the same names intersect, are blank. The exchange rate from one currency to itself is always 1, and no Forex symbols such as "EUREUR" exist.
The dropdown input at the top of the "Settings/Inputs" tab determines the type of information displayed in the table. Two options are available: "Cross rates" and "Heat map" . Both modes color their cells for light and dark themes separately based on the inputs in the "Colors" section.
Cross rates
When a user selects the "Cross rates" display mode, the table's cells show the latest available exchange rate for each currency pair, emulating the behavior of the Cross Rates widget. Each cell's value represents the amount of the quote currency (column name) that equals one unit of the base currency (row name). This display allows users to compare cross rates across currency pairs, and their inverses.
The background color of each cell changes based on the most recent update to the exchange rate, allowing users to monitor the direction of short-term fluctuations as they occur. By default, the background turns green (positive cell color) when the cross rate increases from the last recorded update and red (negative cell color) when the rate decreases. The cell's color reverts to the chart's background color after no new updates are available for 200 milliseconds.
Heat map
When a user selects the "Heat map" display mode, the table's cells show the latest daily percentage change of each currency pair, emulating the behavior of the Heat Map widget.
In this mode, the background color of each cell depends on the corresponding currency pair's daily performance. Heat maps typically use colors that vary in intensity based on the calculated values. This indicator uses the following color coding by default:
• Green (Positive cell color): Percentage change > +0.1%
• No color: Percentage change between 0.0% and +0.1%
• Bright red (Negative cell color): Percentage change < -0.1%
• Lighter/darker red (Minor negative cell color): Percentage change between 0.0% and -0.1%
█ FOR Pine Script™ CODERS
• This script utilizes dynamic requests to iteratively fetch information from multiple contexts using a single request.security() instance in the code. Previously, `request.*()` functions were not allowed within the local scopes of loops or conditional structures, and most `request.*()` function parameters, excluding `expression`, required arguments of a simple or weaker qualified type. The new `dynamic_requests` parameter in script declaration statements enables more flexibility in how scripts can use `request.*()` calls. When its value is `true`, all `request.*()` functions can accept series arguments for the parameters that define their requested contexts, and `request.*()` functions can execute within local scopes. See the Dynamic requests section of the Pine Script™ User Manual to learn more.
• Scripts can execute up to 40 unique `request.*()` function calls. A `request.*()` call is unique only if the script does not already call the same function with the same arguments. See this section of the User Manual's Limitations page for more information.
• Typically, when requesting higher-timeframe data with request.security() using barmerge.lookahead_on as the `lookahead` argument, the `expression` argument should use the history-referencing operator to offset the series, preventing lookahead bias on historical bars. However, the request.security() call in this script uses barmerge.lookahead_on without offsetting the `expression` because the script only displays results for the latest historical bar and all realtime bars, where there is no future information to leak into the past. Instead, using this call on those bars ensures each request fetches the most recent data available from each context.
• The request.security() instance in this script includes a `calc_bars_count` argument to specify that each request retrieves only a minimal number of bars from the end of each symbol's historical data feed. The script does not need to request all the historical data for each symbol because it only shows results on the last chart bar that do not depend on the entire time series. In this case, reducing the retrieved bars in each request helps minimize resource usage without impacting the calculated results.
Look first. Then leap.

Directional Sentiment IndicatorThe Directional Sentiment Indicator is a versatile tool designed to capture price movements by combining several key technical elements, providing traders with actionable insights in volatile and trending markets. This script intelligently integrates price action analysis with the Average True Range (ATR) for precise target zones and directional signals.
Key Components & Their Roles:
1. Moving Averages and ATR Zones: The script utilizes custom high, low, open, and close averages over the selected period to gauge directional bias. By combining these averages with ATR, we define potential high and low targets dynamically, making it easier to visualize potential reversals.
2. Buy/Sell Signals Based on Price Proximity to Extremes: Using calculated price distances from highest/lowest points, the indicator identifies long and short signals when prices reach statistically significant deviations. This is designed to capture trend reversals or continuations at critical junctures, reducing noise from insignificant movements.
3. Highlighting Price Crossovers and Zones: The script plots boxes when price crosses above or below critical ATR levels, providing clear visual zones where price may experience increased resistance or support. This functionality helps users identify areas where market direction may shift.
4. Dynamic Plotting of Highs/Lows: With options to plot crossover and undershoot signals, traders can visually assess momentum shifts with green and red arrows for bullish and bearish crossovers respectively. This visual overlay enhances the trader’s ability to make quicker decisions.
This unique combination not only marks direction and key reversal areas but also provides context with ATR-based range boxes, making it an essential tool for traders seeking both clarity and precision in market movements.

Dynamic Linear CandlesDynamic Linear Candles is a unique and versatile indicator that reimagines traditional candlestick patterns by integrating customizable moving averages directly into candle structures. This dynamic approach smooths the appearance of candlesticks to better highlight trends and suppress minor market noise, allowing traders to focus on essential price movements.
Key Features:
1. Dynamic Candle Smoothing: Choose between popular smoothing types (SMA, EMA, WMA, HMA) to apply directly to each candle’s Open, High, Low, and Close values. This adaptive smoothing reveals hidden trends by refining price action into simplified, flowing candles, ideal for spotting subtle changes in market sentiment.
2. Signal Line Overlay: The signal line provides an additional layer of trend confirmation. Select from SMA, EMA, WMA, or HMA smoothing to match your trading style. The line dynamically changes color based on the price’s relative position, helping traders quickly identify bullish or bearish shifts.
3. Enhanced Candle Visualization: Candles adjust in color and opacity based on bullish or bearish trends, providing immediate visual cues about market momentum. The customized color and opacity settings allow for clearer distinction, especially in noisy markets.
Why This Combination?
This script is more than just an aesthetic adjustment; it’s a purposeful combination of moving averages and candle smoothing designed to enhance readability and actionable insights. Traditional candles often suffer from excessive noise in volatile markets, and this mashup addresses that by creating a smooth, flowing chart that adapts to the underlying trend. The Signal Line adds confirmation, acting as a filter for potential entries and exits. Together, these elements serve as a concise toolset for traders aiming to capture trend-based opportunities with clarity and precision.

Trend IdentifierThe “Trend Identifier” indicator is designed to help traders quickly identify trending and sideways market conditions, allowing them to adapt their strategies based on the prevailing market sentiment. By combining several technical analysis tools—ATR (Average True Range), ADX (Average Directional Index), EMA (Exponential Moving Average), and RSI (Relative Strength Index)—this script provides insights into the market’s strength, direction, and volatility to improve trade decision-making.
How It Works
1. ATR (Average True Range):
• ATR measures market volatility. In this script, ATR is used in combination with a moving average to identify periods of rising or falling volatility, which helps differentiate between trending and non-trending conditions.
2. ADX (Average Directional Index):
• ADX is a key component in identifying the strength of a trend. The script uses a threshold system to classify market conditions:
• If ADX is low (below a specified threshold plus a buffer) and ATR indicates low volatility, the market is likely in a sideways condition.
• If ADX is high (above a threshold minus a buffer) with increasing ATR, the market is likely in a trending condition.
3. EMA (Exponential Moving Average):
• A 20-period EMA is used instead of a simple moving average to enhance trend detection speed. The close price’s position relative to the EMA helps identify bullish or bearish trends when combined with ADX and ATR data.
4. RSI (Relative Strength Index):
• RSI acts as a confirmation tool for trend strength. A bullish trend is confirmed if RSI is above 50 and the price is above the EMA, whereas a bearish trend is confirmed if RSI is below 50 and the price is below the EMA.
Market Condition Signals
• Sideways Signal:
• When ADX and ATR indicate a low-volatility, sideways market, the indicator changes the background color to gray, signaling potential low-trend movement or consolidation. A “S” symbol appears above the bars, making it easier to spot this condition.
• Bullish Trend:
• When conditions favor a strong upward trend, the background changes to green. A “B” symbol is displayed below the bar, indicating the onset of a bullish market condition.
• Bearish Trend:
• Conversely, if conditions indicate a downward trend, the background color changes to red. A “S” symbol is displayed below the bar, showing a bearish trend condition.
Using the Indicator
This indicator helps traders understand the current market structure in a glance:
• Sideways (Gray): Low-volatility consolidation period, ideal for range-bound strategies or waiting for a breakout.
• Bullish (Green): Confirmed uptrend, potentially suitable for buying or long entries.
• Bearish (Red): Confirmed downtrend, ideal for short selling or exiting long positions.
The “Trend Identifier” is a powerful tool for traders who seek a clear view of the market structure, using a balanced approach of volatility, trend strength, and momentum. By combining the power of ATR, ADX, EMA, and RSI, this indicator provides a nuanced picture of the market’s behavior, assisting traders in making more informed decisions.

Forex Relative Strength MatrixTraders often feel uncertain about which Forex pair to open a position with. This indicator is designed to help in that regard.
This indicator was created as described in the book Swing Trading with Heiken Ashi and Stochastics. In the original, the author suggests using it for swing trading. The author recommends applying it to a monthly chart with an 8-period moving average to analyze the context.
The logic of the indicator is to measure the relative strength of each currency by checking if the price of each Forex pair is above or below a chosen moving average. If the price is above the moving average, the base currency is awarded 1 point, indicating strength. If below, it scores 0, indicating weakness. By accumulating points across multiple pairs, the indicator ranks currencies from strongest to weakest, helping traders identify potential pairs for trading.
Trend Identification:
After identifying relative strength, the trader should observe the general trend using a 100-period SMA on 4-hour charts. If the price is above the SMA, the trend is bullish; if below, it is bearish.
Buy Logic:
A buy is triggered when the base currency is strong (price is above the moving average) and the quote currency is weak (price is below the moving average). After identifying the trend direction, the entry is confirmed by a color change in Heiken Ashi candles (from red to green in an uptrend) and a stochastic crossover in the trend’s direction.
Sell Logic:
A sell is triggered when the base currency is weak (price is below the moving average) and the quote currency is strong (price is above the moving average). The sell entry is confirmed by a color change in Heiken Ashi candles (from green to red in a downtrend) and a stochastic crossover aligned with the trend.
Entry Chart:
The entry chart used is the 4-hour chart. The trader should look for entry signals following a pullback in the trend direction, using Heiken Ashi candles. Entry is made when the Heiken Ashi candles change color (from red to green in an uptrend) and there is a smooth crossover of the stochastic indicator in the trend’s direction.
It would also be possible to adapt the indicator for day trading strategies with targets of 1 to 2 days. Here is a recommended setup:
Relative Strength Identification (1-Hour Chart):
Instead of monthly charts, use a 1-hour chart to identify currency strength with a 20-period moving average.
The 20-period moving average on the 1-hour chart captures a balanced view of short- to medium-term direction, covering nearly a day’s worth of trading but with enough sensitivity for day trading.
General Trend (5-Minute Chart with 100 SMA):
On the 5-minute chart, observe the 100-period SMA to identify the general trend direction throughout the day.
Price above the 100 SMA indicates an uptrend, and below indicates a downtrend, confirming the movement in shorter timeframes.
Entry Chart and Signals (5-Minute Chart):
Use the 15-minute chart to look for entry opportunities, focusing on pullbacks in the main trend direction.
Entry Signals: Enter the position when Heiken Ashi candles change color in the trend direction (from red to green in an uptrend) and the stochastic indicator makes a smooth crossover in the trend’s direction.

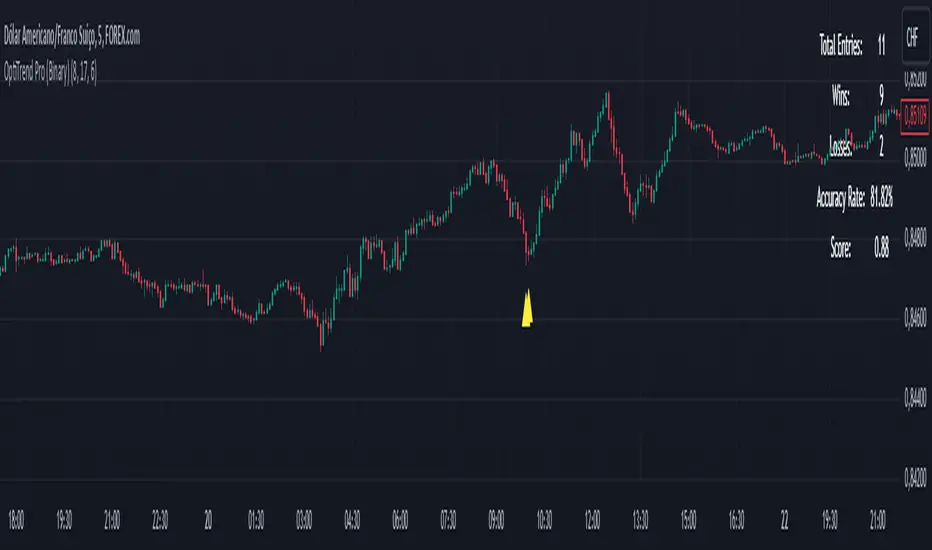
OptiTrend Pro (Binary)
OptiTrend Pro for Binary Options
The OptiTrend Pro indicator is specifically crafted for binary options trading, providing timely, accurate buy and sell alerts with clear arrow signals. This advanced tool combines multiple indicators, offering a comprehensive analysis of trends, volatility, momentum, and key levels, which help traders make well-informed decisions in digital asset markets.
Key Features:
Scoring System: OptiTrend Pro uses a scoring system based on the accuracy and frequency of signals, giving you an objective way to assess the quality of signals. This composite score considers both the hit rate and the number of entries, allowing you to focus on higher-quality setups. Alerts are only sent if the signal score is above 0.5, ensuring notifications are limited to strong signals.
Custom Time Filter: Designed to focus your trading to specific hours, the time filter aligns with the America/Sao_Paulo time zone. For optimal results, we recommend setting the time filter from 8 AM to 5 PM, especially when trading major Forex pairs like EURUSD, GBPUSD, USDJPY, AUDUSD, and USDCAD.
Result Tracking & Win/Loss Counts: Easily monitor win/loss ratios based on a set number of candlesticks (user-defined), which aids in assessing strategy success.
Flexible Alert System: Receive alerts for bullish and bearish signals with arrow markers, ensuring clarity for entries. Additionally, users can set a minimum score to trigger alerts, focusing only on high-quality signals.
How to Use:
Adjust the Parameters: Customize each indicator, time filter, and win/loss tracking period based on your binary trading needs.
Follow the Arrows: Look for bullish signals (up arrows) for buy opportunities and bearish signals (down arrows) for sell opportunities.
Monitor Performance: Leverage the win/loss tracking system and composite score to assess the effectiveness of the signals and optimize your setup.
Set Alerts: Enable alerts to stay informed of new signals as they happen, with filtering options based on your confidence level. Remember, alerts are triggered only if the signal score exceeds 0.5, ensuring that only strong opportunities prompt a notification.
Interpreting the Signals:
Bullish Signal (Up Arrow): Indicates a potential opportunity to enter a buy position as price may rise.
Bearish Signal (Down Arrow): Signals a potential sell position as price may decline.
Usage Tips:
Use OptiTrend Pro alongside other analysis tools for confirmation and additional context.
Adjust the indicator settings to suit the specific asset and timeframe you’re working with.
Apply the results simulation to refine your strategy and manage risk effectively.
This indicator is ideal for binary options on 5-minute and 15-minute charts, designed for entries of 20 and 90 minutes, respectively. For best performance, trade during the 8 AM to 5 PM window on major Forex pairs.
Disclaimer: OptiTrend Pro is a support tool for making trading decisions. It does not guarantee profits and should not be your sole basis for trading. Perform your own analysis and trade responsibly.
Try OptiTrend Pro now to refine your strategies with precise alerts and complete market insights!
Divergence for Many Indicators v4 Screener▋ INTRODUCTION:
The “Divergence for Many Indicators v4 Screener” is developed to provide an advanced monitoring solution for up to 24 symbols simultaneously. It efficiently collects signals from multiple symbols based on the “ Divergence for Many Indicators v4 ” and presents the output in an organized table. The table includes essential details starting with the symbol name, signal price, corresponding divergence indicator, and signal time.
_______________________
▋ CREDIT:
The divergence formula adapted from the “ Divergence for Many Indicators v4 ” script, originally created by @LonesomeTheBlue . Full credit to his work.
_______________________
▋ OVERVIEW:
The chart image can be considered an example of a recorded divergence signal that occurred in $BTCUSDT.
_______________________
▋ APPEARANCE:
The table can be displayed in three formats:
1. Full indicator name.
2. First letter of the indicator name.
3. Total number of divergences.
_______________________
▋ SIGNAL CONFIRMATION:
The table distinguishes signal confirmation by using three different colors:
1. Not-Confirmed (Orange): The signal is not confirmed yet, as the bar is still open.
2. Freshly Confirmed (Green): The signal was confirmed 1 or 2 bars ago.
3. Confirmed (Gray): The signal was confirmed 3 or more bars ago.
_______________________
▋ INDICATOR SETTINGS:
Section(1): Table Settings
(1) Table location on the chart.
(2) Table’s cells size.
(3) Chart’s timezone.
(4) Sorting table.
- Signal: Sorts the table by the latest signals.
- None: Sorts the table based on the input order.
(5) Table’s colors.
(6) Signal Confirmation type color. Explained above in the SIGNAL CONFIRMATION section
Section(2): Divergence for Many Indicators v4 Settings
As seen on the Divergence for Many Indicators v4
* Explained above in the APPEARANCE section
Section(3): Symbols
(1) Enable/disable symbol in the screener.
(2) Entering a symbol.
_______________________
▋ FINAL COMMENTS:
For best performance, add the Screener indicator to an active symbol chart, such as QQQ, SPY, AAPL, BTCUSDT, ES, EURUSD, etc., and avoid mixing symbols from different market allocations.
The Divergence for Many Indicators v4 Screener indicator is not a primary tool for making trading decisions.

Forex LEAcademyForex LEAcademy Indicator
Overview:
The Forex LEAcademy script is designed for forex traders who want to visualize key price levels during the Asian trading session. This script highlights the high and low points of a specified candle time and dynamically draws lines to represent critical levels for market analysis.
Key Features:
Session Time Management:
Users can set the specific time frame to focus on, allowing for targeted analysis during the Asian trading session.
Dynamic Highlighting:
The indicator automatically highlights the background during the specified candle time, making it easy to identify the session at a glance.
Price Level Calculation:
At the beginning of each new session, the script calculates and stores the high and low values of the defined candle, which are essential for identifying potential breakout or reversal points.
Visual Representation:
The indicator draws horizontal lines on the chart to represent:
The first high and low of the session.
Additional levels above and below the initial range (T1, T2, T3, T4), calculated based on the candle height. These levels provide valuable insights for setting target prices and stop-loss levels.
Customizable Input Parameters:
Users can customize the time frame for the candle being analyzed, enhancing flexibility for different trading strategies.
Usage:
This indicator is ideal for traders looking to capitalize on the price movements in the forex market, particularly during the Asian session. By understanding the high and low points within this critical time frame, traders can make informed decisions based on market behavior.

H-Infinity Volatility Filter [QuantAlgo]Introducing the H-Infinity Volatility Filter by QuantAlgo 📈💫
Enhance your trading/investing strategy with the H-Infinity Volatility Filter , a powerful tool designed to filter out market noise and identify clear trend signals in volatile conditions. By applying an advanced H∞ filtering process, this indicator assists traders and investors in navigating uncertain market conditions with improved clarity and precision.
🌟 Key Features:
🛠 Customizable Noise Parameters: Adjust worst-case noise and disturbance settings to tailor the filter to various market conditions. This flexibility helps you adapt the indicator to handle different levels of market volatility and disruptions.
⚡️ Dynamic Trend Detection: The filter identifies uptrends and downtrends based on the filtered price data, allowing you to quickly spot potential shifts in the market direction.
🎨 Color-Coded Visuals: Easily differentiate between bullish and bearish trends with customizable color settings. The indicator colors the chart’s candles according to the detected trend for immediate clarity.
🔔 Custom Alerts: Set alerts for trend changes, so you’re instantly informed when the market transitions from bullish to bearish or vice versa. Stay updated without constantly monitoring the charts.
📈 How to Use:
✅ Add the Indicator: Add the H-Infinity Volatility Filter to your favourites and apply it to your chart. Customize the noise and disturbance parameters to match the volatility of the asset you are trading/investing. This allows you to optimize the filter for your specific strategy.
👀 Monitor Trend Shifts: Watch for clear visual signals as the filter detects uptrends or downtrends. The color-coded candles and line plots help you quickly assess market conditions and potential reversals.
🔔 Set Alerts: Configure alerts to notify you when the trend changes, allowing you to react quickly to potential market shifts without needing to manually track price movements.
🌟 How It Works and Academic Background:
The H-Infinity Volatility Filter is built on the foundations of H∞ (H-infinity) control theory , a mathematical framework originating from the field of engineering and control systems. Developed in the 1980s by notable engineers such as George Zames and John C. Doyle , this theory was designed to help systems perform optimally under uncertain and noisy conditions. H∞ control focuses on minimizing the worst-case effects of disturbances and noise, making it a powerful tool for managing uncertainty in complex environments.
In financial markets, where unpredictable price fluctuations and noise often obscure meaningful trends, this same concept can be applied to price data to filter out short-term volatility. The H-Infinity Volatility Filter adopts this approach, allowing traders and investors to better identify potential trends by reducing the impact of random price movements. Instead of focusing on precise market predictions, the filter increases the probability of highlighting significant trends by smoothing out market noise.
This indicator works by processing historical price data through an H∞ filter that continuously adjusts based on worst-case noise levels and disturbances. By considering several past states, it estimates the current price trend while accounting for potential external disruptions that might influence price behavior. Parameters like "worst-case noise" and "disturbance" are user-configurable, allowing traders to adapt the filter to different market conditions. For example, in highly volatile markets, these parameters can be adjusted to manage larger price swings, while in more stable markets, they can be fine-tuned for smoother trend detection.
The H-Infinity Volatility Filter also incorporates a dynamic trend detection system that classifies price movements as bullish or bearish. It uses color-coded candles and plots—green for bullish trends and red for bearish trends—to provide clear visual cues for market direction. This helps traders and investors quickly interpret the trend and act on potential signals. While the indicator doesn’t guarantee accuracy in trend prediction, it significantly reduces the likelihood of false signals by focusing on meaningful price changes rather than random fluctuations.
How It Can Be Applied to Trading/Investing:
By applying the principles of H∞ control theory to financial markets, the H-Infinity Volatility Filter provides traders and investors with a sophisticated tool that manages uncertainty more effectively. Its design makes it suitable for use in a wide range of markets—whether in fast-moving, volatile environments or calmer conditions.
The indicator is versatile and can be used in both short-term trading and medium to long-term investing strategies. Traders can tune the filter to align with their specific risk tolerance, asset class, and market conditions, making it an ideal tool for reducing the effects of market noise while increasing the probability of detecting reliable trend signals.
For investors, the filter can help in identifying medium to long-term trends by filtering out short-term price swings and focusing on the broader market direction. Whether applied to stocks, forex, commodities, or cryptocurrencies, the H-Infinity Volatility Filter helps traders and investors interpret market behavior with more confidence by offering a more refined view of price movements through its noise reduction techniques.
Disclaimer:
The H-Infinity Volatility Filter is designed to assist in market analysis by filtering out noise and volatility. It should not be used as the sole tool for making trading or investment decisions. Always incorporate other forms of analysis and risk management strategies. No statements or signals from this indicator or us should be considered financial advice. Past performance is not indicative of future results.

Forex Macro Metrics [MacroGlide]"Forex Macro Metrics " is a powerful tool for analyzing macroeconomic metrics, designed to help traders make more informed decisions in the forex market. This indicator displays key economic indicators such as interest rates, money supply (M1 and M2), unemployment rate, and government debt for various currencies and their pairs, allowing users to assess the macroeconomic differences between the base and quote currencies.
Key Features:
• Interest Rates Display: Includes interest rates for major world currencies with the ability to show the differential between the base and quote currencies.
• Money Supply Analysis (M1 and M2): Displays the money supply for both the base and quote currencies, including differential calculations.
• Unemployment Rate: Compares the unemployment rates between currencies, showing the differences on the chart.
• Government Debt: Shows government debt levels for the base and quote currencies with differential calculations.
• Customizable Options: Enable/disable specific metrics and adjust colors for better visual clarity.
How to Use:
• Select a Currency Pair: Apply the indicator to your chart and choose the desired currency pair. The indicator will automatically load the relevant data for the base and quote currencies.
• Adjust Display Settings: Use the indicator settings to enable or disable specific metrics and their differentials.
• Analyze the Data: Compare the economic conditions of the two currencies through the charts and identify potential trading opportunities based on macroeconomic differences.
Methodology:
The indicator uses economic data available through TradingView tickers to calculate the values of the base and quote currencies. Differentials are calculated by subtracting the values of the quote currency from the base currency, allowing for a visual assessment of their differences. The displayed data includes historical changes, helping to identify trends and potential reversal points.
Originality and Usefulness:
"Forex Macro Metrics " is a unique tool that combines several key macroeconomic indicators into one comprehensive indicator. This simplifies the analysis process for traders looking to understand the fundamental differences between currencies. Using this approach provides an advantage in assessing long-term trends and potential shifts in currency pairs driven by changes in macroeconomic conditions.
Charts:
The indicator displays data in the form of lines and areas on the chart, with interest rates shown as lines for the base and quote currencies, accompanied by an area representing the differential. For money supply (M1 and M2), lines are drawn for each currency, with areas highlighting the differences. Similarly, the unemployment rate and government debt are displayed with clear visual separation of the data and their differentials, making it easy to compare and analyze the macroeconomic conditions of the currencies involved.
Enjoy the game!